Debugging
As Parcel automatically generates sourcemaps by default, setting up debugging with Parcel involves minimal effort for the most part.
Chrome Developer Tools
#Assuming that source maps are enabled, no extra configuration is required. For example, suppose you had a folder structure like the following:
<!DOCTYPE html>
<html>
  <head>
    <title>Chrome Debugging Example</title>
  </head>
  <body>
    <h1 id="greeting"></h1>
    <script src="./index.ts"></script>
  </body>
</html>const variable: string = "Hello, World!";
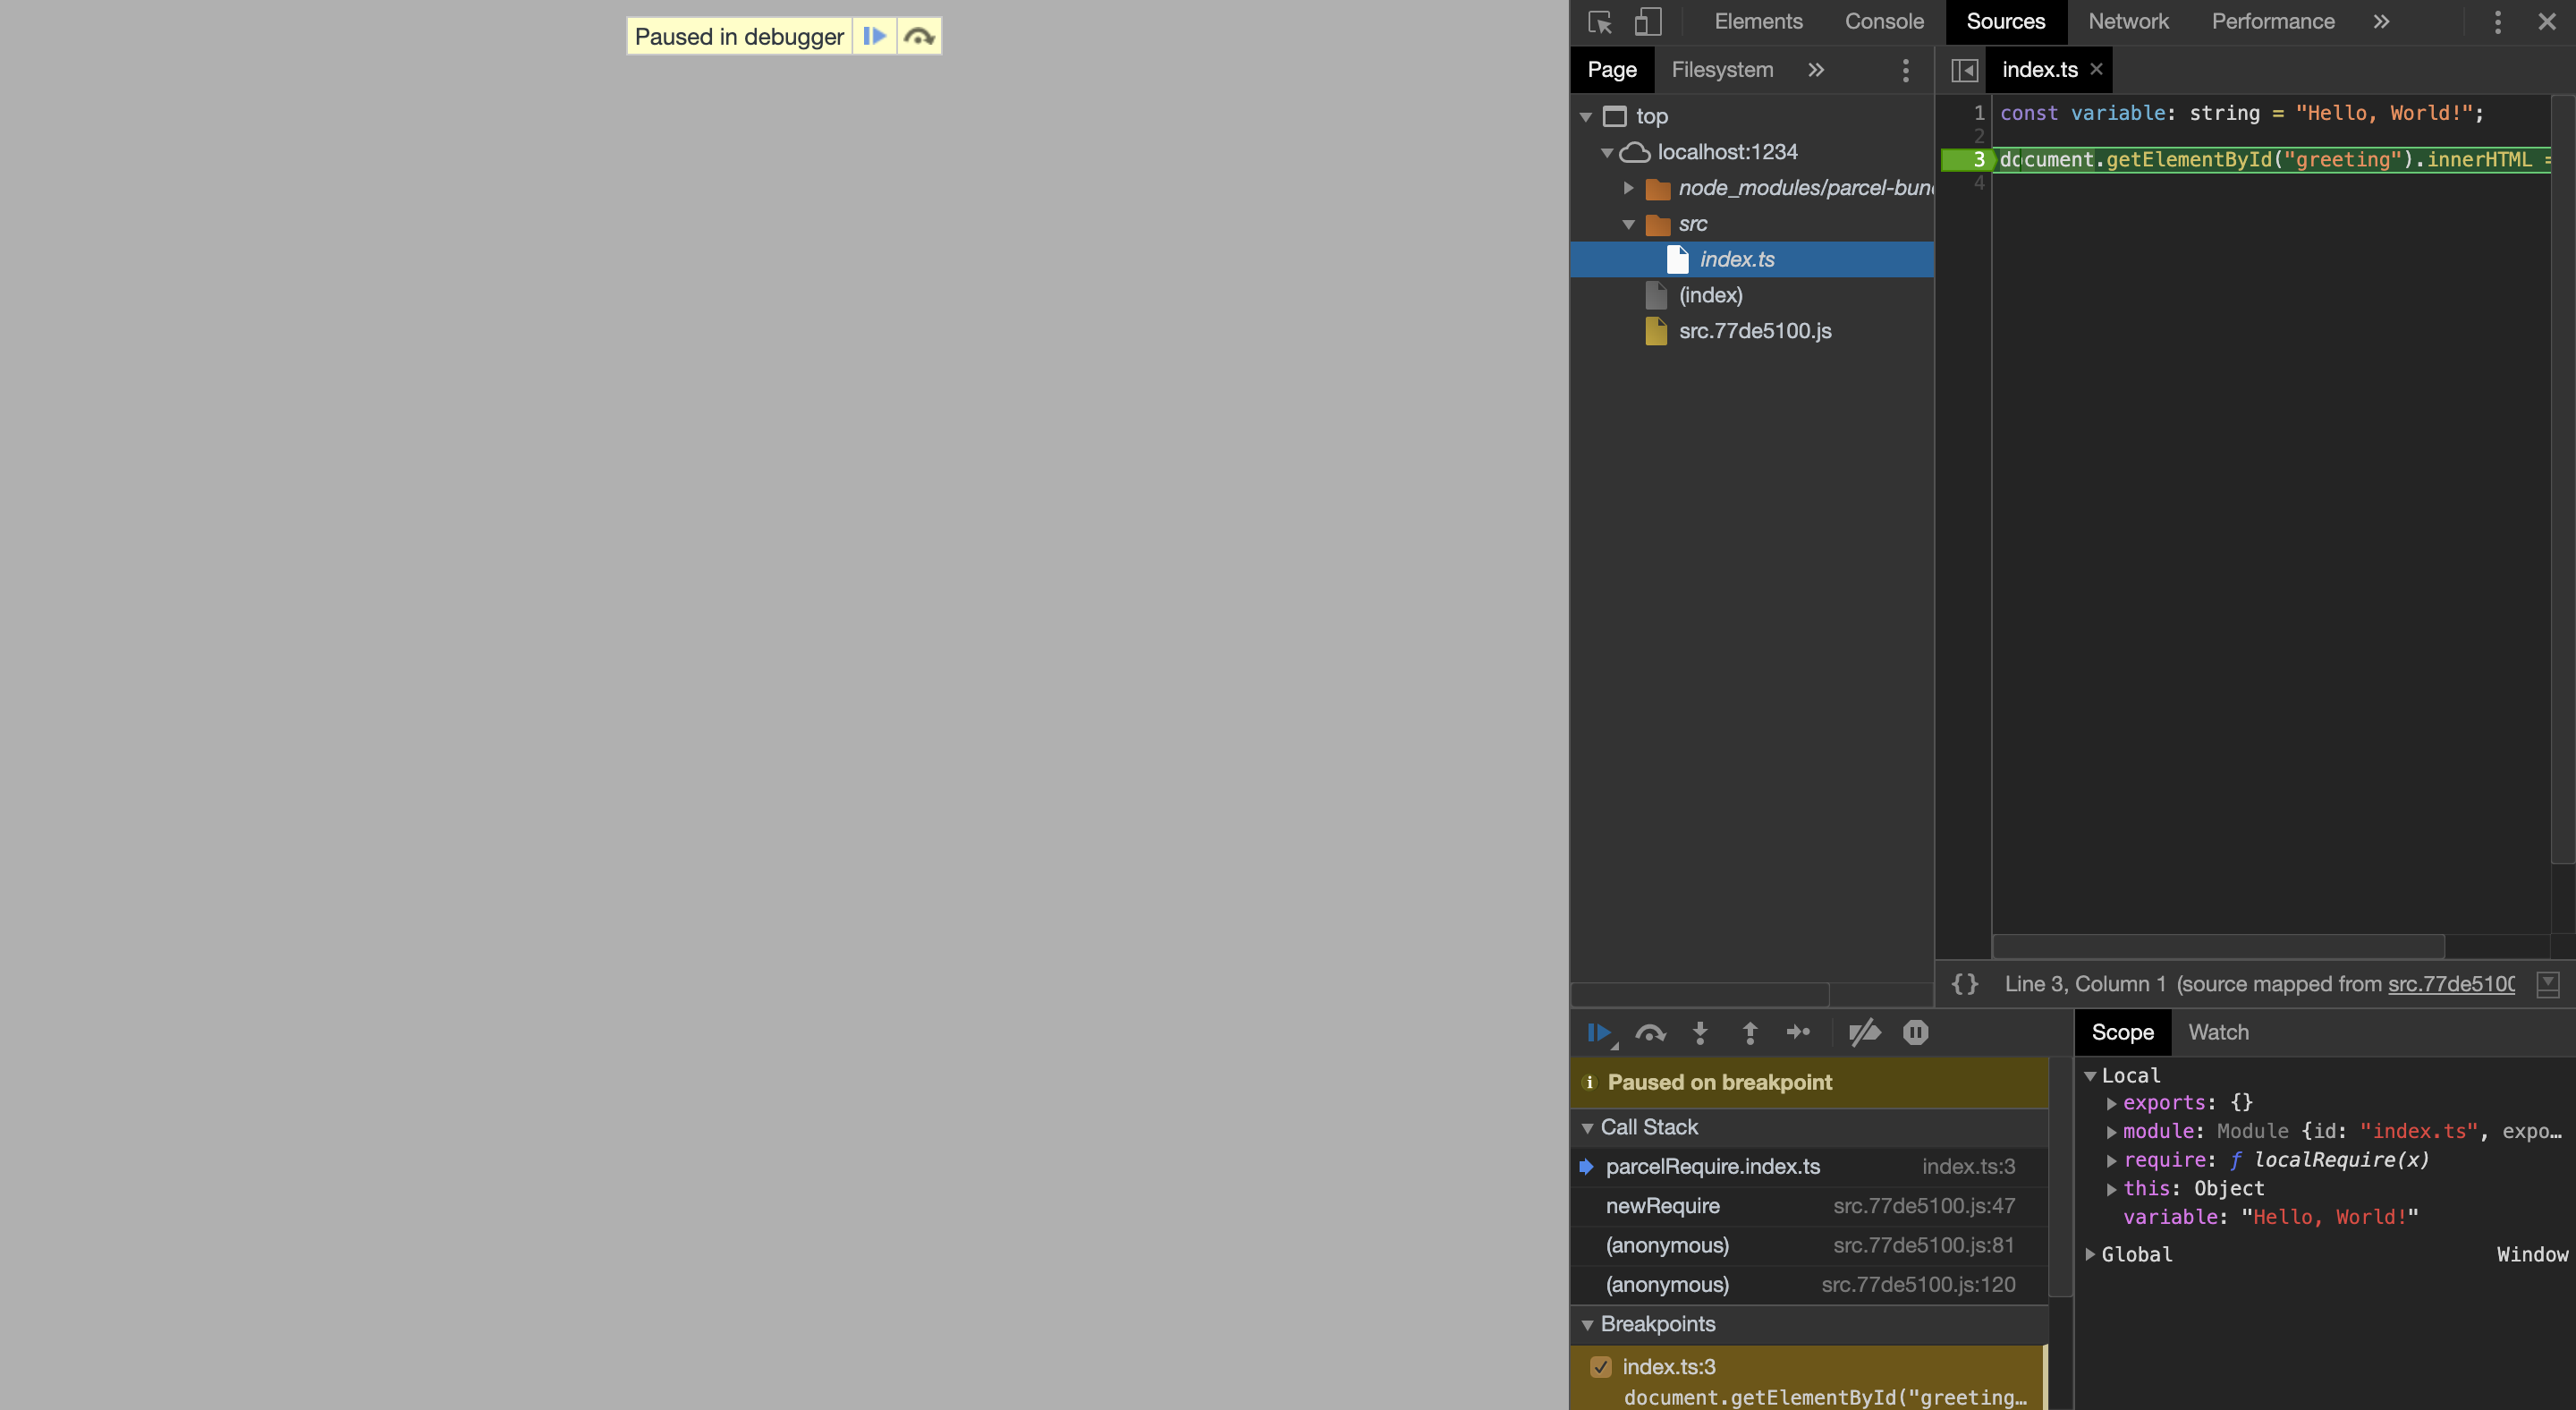
document.getElementById("greeting").innerHTML = variable;With this setup, you can run parcel src/index.html and set breakpoints in the source code, as seen below:

Visual Studio Code
#Assuming a folder/file structure similar to the one shown above for Chrome developer tools, the following launch.json can be used with the Debugger for Chrome extension:
{
  // Use IntelliSense to learn about possible attributes.
  // Hover to view descriptions of existing attributes.
  // For more information, visit: https://go.microsoft.com/fwlink/?linkid=830387
  "version": "0.2.0",
  "configurations": [
    {
      "type": "chrome",
      "request": "launch",
      "name": "Launch Chrome against localhost",
      "url": "http://localhost:1234",
      "webRoot": "${workspaceFolder}",
      "breakOnLoad": true,
      "sourceMapPathOverrides": {
        "../*": "${webRoot}/*",
        "/__parcel_source_root/*": "${webRoot}/*"
      }
    }
  ]
}
Next, you will need to start the parcel dev server with your entry point, which here is index.html:
$ parcel src/index.html
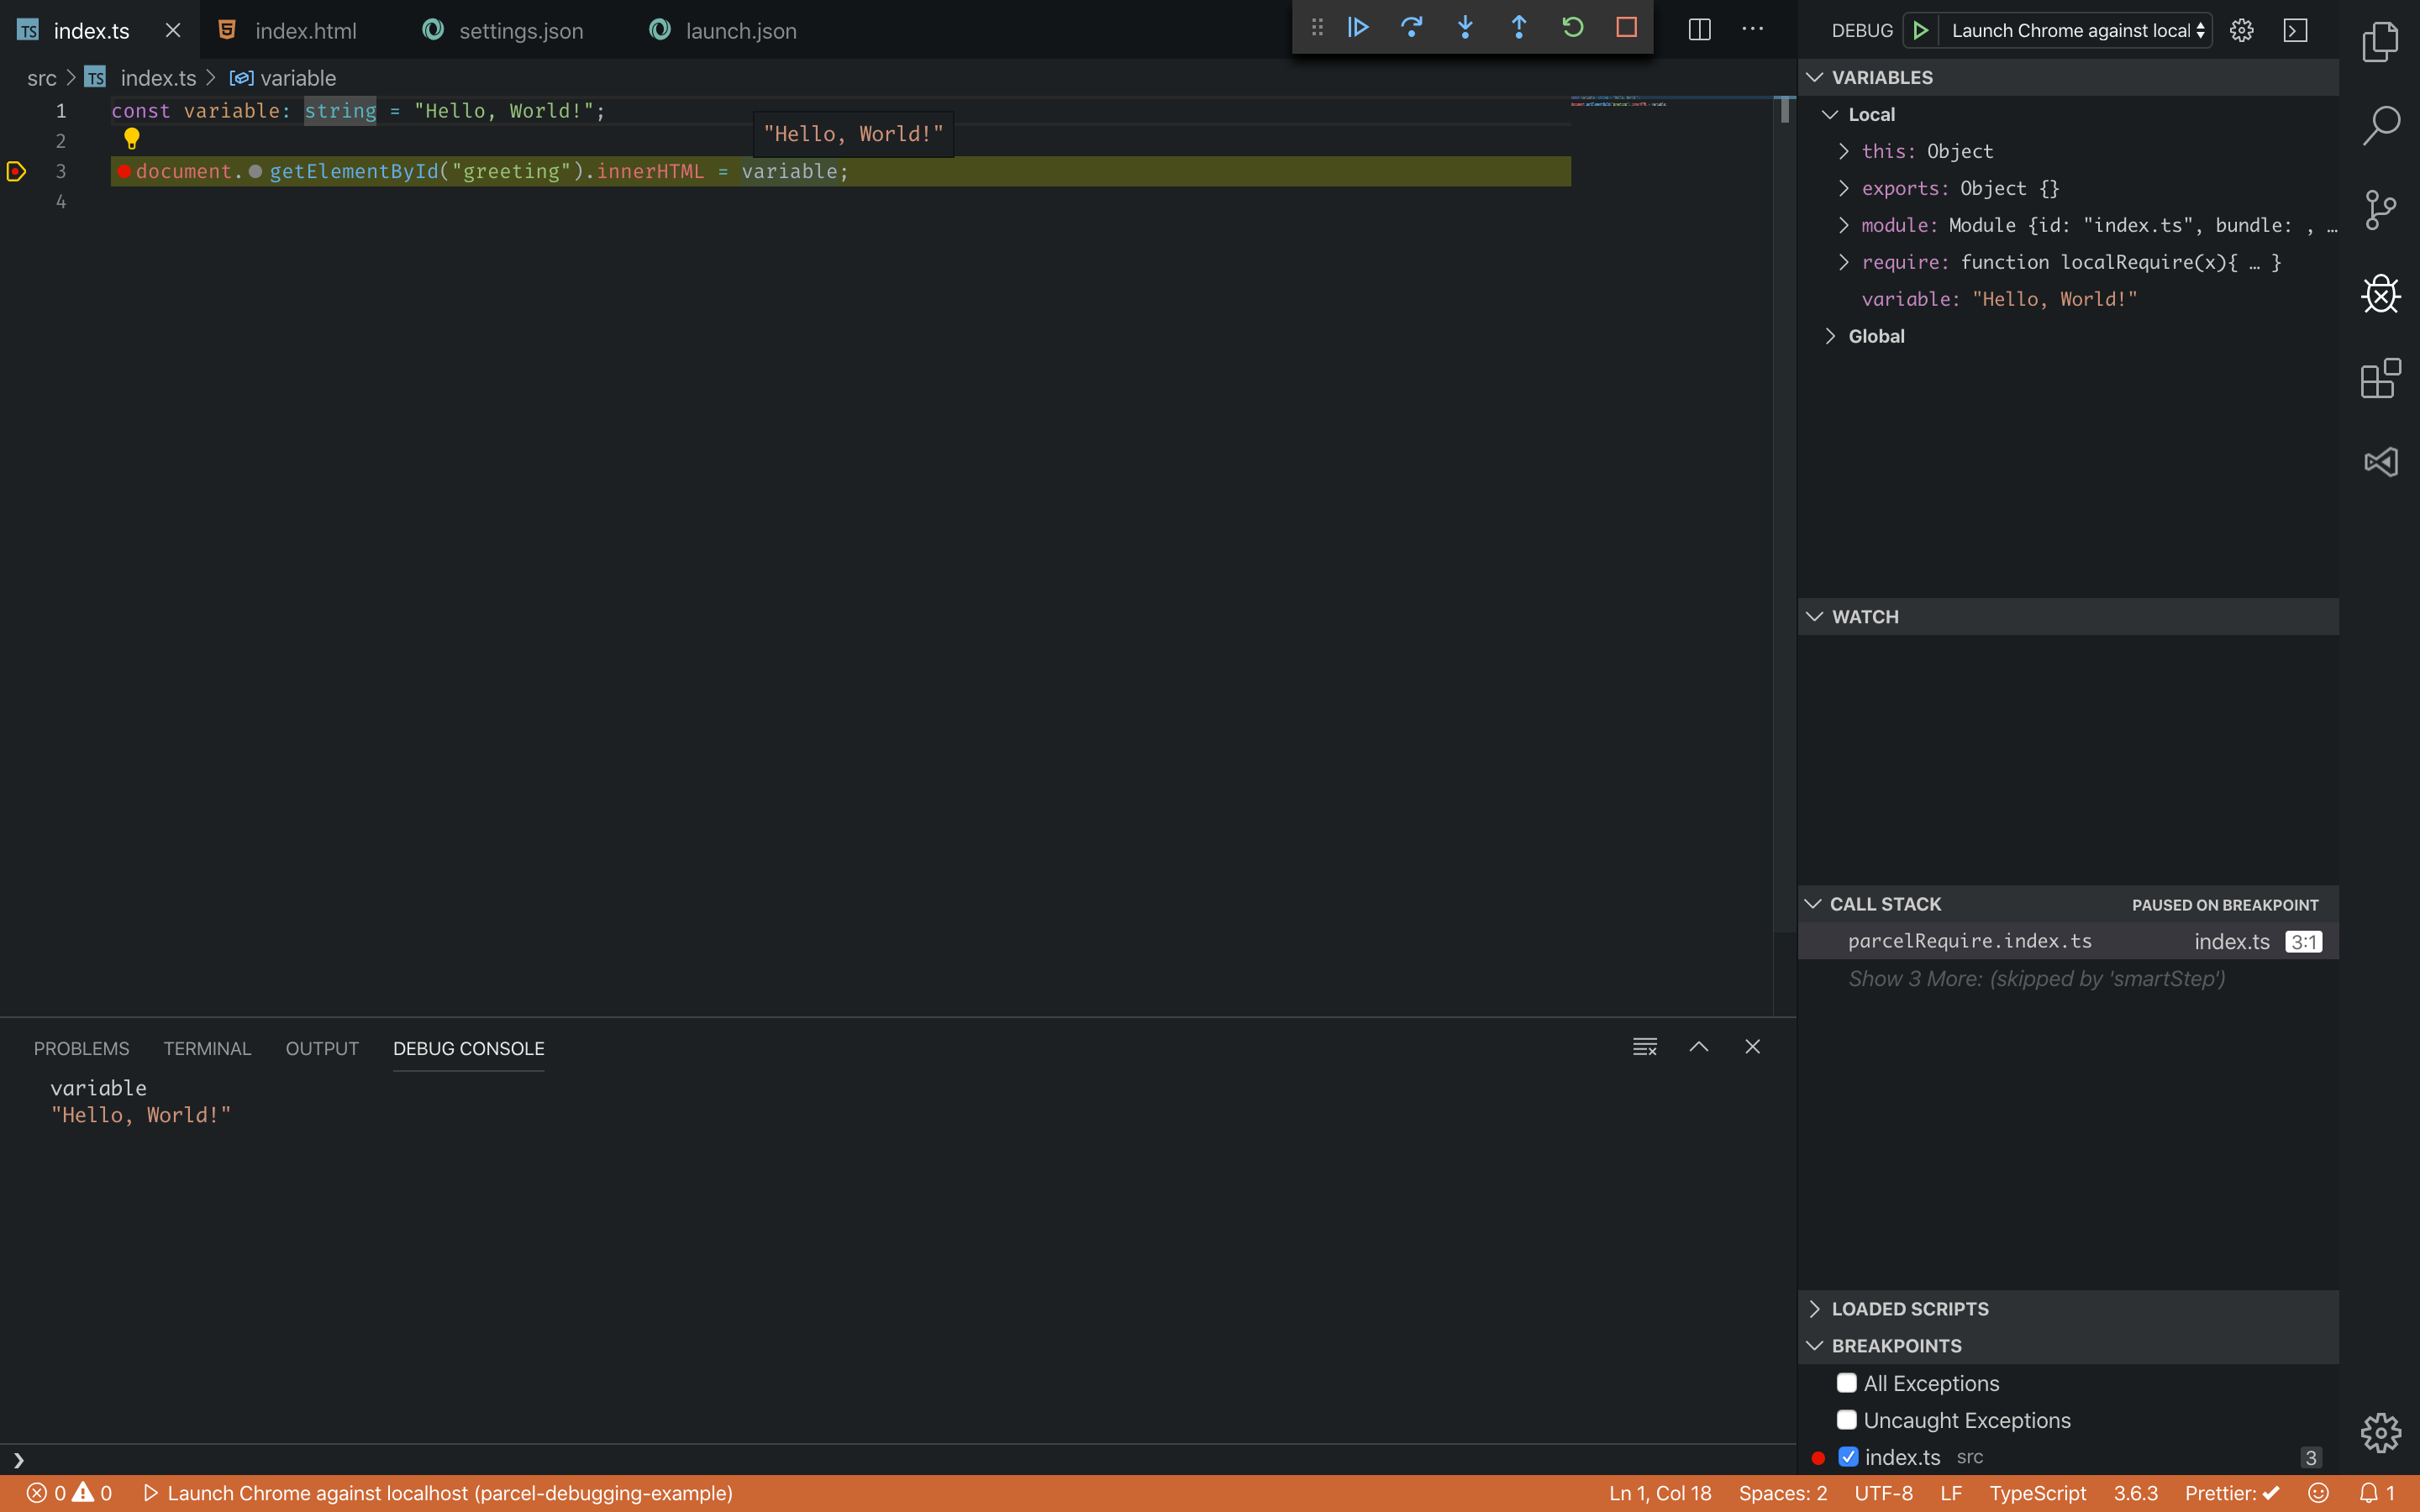
The last step here is to actually start the debugging process by clicking Green arrow in the debug panel. You should now be able to set breakpoints in your code. The final result will look similar to the following:
